Contact
If, after you have bought SugarPal, you have a question which is not yet addressed anywhere on the website, or want to report a bug, you can contact me by email. I tried to make the description of the application as clear and complete as possible, in the hope that it will be useful for you.

About me
My name is Luuk Tiemeijer. About 20 years ago I was diagnosed with late-onset type 1 diabetes (LADA). After 8 years I switched from a 2 times daily to a 4 times daily insulin regimen. After writing down all the blood glucose readings and insulin injections into a paper diary for a while, I started using a spreadsheet program for this. In the cells intended for recording the insulin dose I used a formula whereby, based on the insulin dose of the previous day, the observed increases or decreases in blood sugar level, and a carefully defined blood sugar correction factor, the new insulin dose was calculated. This worked very well but was not particularly user friendly.
This became a lot better after I incorporated this control algorithm into a separate blood sugar management program for my Psion 3 organizer. This program has helped me over a period of 12 years to keep my HbA1c between 6 and 7% and yet avoid severe hypoglycemia. Since the production of the Psion 3 hand-held organizer had been discontinued for many years already, and getting second-hand replacements also became difficult, in 2010 it was time for a successor with more features, for one of the best and most stable mobile platforms available at this moment, the Apple iPhone. The SugarPal Diabetes Manager application is the result.
About my diabetes
In the past 20 years I have always been looking for the best insulin doses to treat my diabetes as well as possible. In essence, that's pretty simple. If, after measurement, the blood glucose level appears to be too high, this can be rectified by taking some additional insulin at the earliest opportunity. In addition, the inappropriate insulin dose should be increased in the future, continuing until you regularly end up on target. Obviously, I did this kind of adjustments in very small steps. Usually only with a few tenths of an insulin unit. If, on the other hand, my blood glucose appeared to end up too low, I did these adjustments in the other direction. I started in 1990 with 30 insulin units per day, and discovered soon that due to my new diet, which contained more slow carbohydrates and fiber, I could do with significantly less insulin. After one year with only a few units per day. Then my insulin requirements slowly went up again. The honeymoon period was over. From now on my own insulin production would gradually decline, and I had to inject larger amounts of artificial insulin. After 8 years I found that I could no longer keep my HbA1c under 7% with a two times daily regimen, and, following my doctors advice, switched to a four times daily insulin regimen. I started with approximately 20 units of insulin per day. But this has now risen to about 50 units of insulin per day.
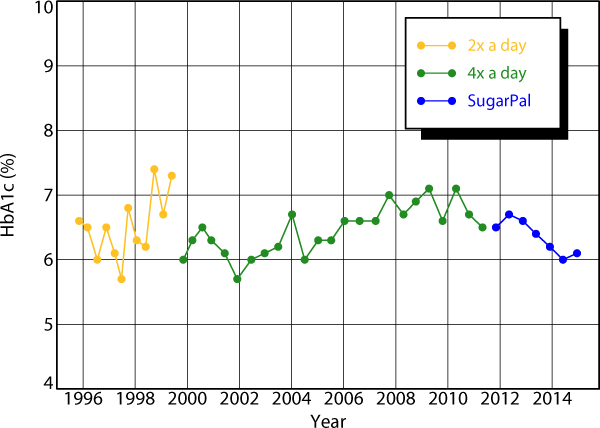
Overview of my HbA1c values (in the old units) over the past 18 years.
As can be seen in the above statement of my HbA1c values, since the beginning of my four times daily insulin regimen, now 14 years ago, I have been able regulate my blood sugar levels quite well. I always measured my blood sugar level before each insulin injection, and typically adjusted my insulin dose by a few tenths of an unit in order to get to my blood sugar targets. I used a blood sugar correction factor of 0.5 when calculating my next insulin dose and to find the desired insulin baseline adjustment. My doctor was always satisfied and then asked me how often I had hypos. A fair question, because a beautiful HbA1c value just means that the blood sugar levels have been well on average. It does not tell anything about any interim outliers. To track these, you need to keep a diabetes diary. Or use an app like SugarPal.
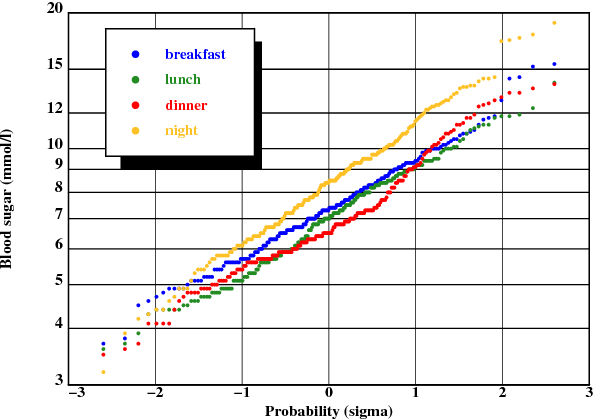
Overview of my blood sugar values of the last seven months as measured with my OneTouch Verio blood glucose meter.
Above you will find an overview of the blood sugar values I measured the last seven months using my OneTouch Verio blood glucose meter. It turns out that these blood sugar readings are very well described with a lognormal distribution. To create this graph, first you need to sort an array of your blood sugar readings by ascending value. Then you determine the probability for each measurement using the Excel function NORMSINV (i / (1 + n)) where i is the index (1, 2, etc.) of each measurement, and n is the number of measurements in your series. The function result is plotted along the x-axis, and the corresponding blood sugar reading is plotted logarithmically onto the y-axis. After, let Excel fit an exponential trend line to the result, and display its equation and R-squared value. The two fit parameters are the median and spread of the distribution. The median is approximately, but not exactly, the same as the average of your blood sugar readings. The spread is a measure of the outliers. The larger the spread, the more outliers. The R-squared value indicates how well the blood glucose is log-normally distributed. It is also very interesting to let Excel calculate the correlation coefficients between successive blood sugars. The results can be found in the table below.
| Series | Measurements | Median | Spread | R-squared | Correlation |
|---|---|---|---|---|---|
| breakfast | 212 | 7.4 mmol/l | 0.25 | 0.992 | 0.03 |
| lunch | 212 | 6.9 mmol/l | 0.27 | 0.992 | 0.20 |
| dinner | 212 | 6.8 mmol/l | 0.27 | 0.968 | 0.15 |
| night | 212 | 8.3 mmol/l | 0.31 | 0.996 | 0.06 |
| all | 18756 | 6.5 mmol/l | 0.31 | 0.993 |
Now some interesting conclusions can be drawn. Before breakfast, the spread in my blood sugar readings is at its lowest. Because apparently I succeed well in correcting abnormal blood sugar levels with insulin dose adjustments, there is hardly any correlation with my prior blood sugar readings for the night. Since I sleep and do not eat anything at night, this spread of 0.25 can only be due to insulin dosage errors and fluctuations in my natural insulin requirements. Where exactly these fluctuations come from I do not know. I can come up with something, but it remains a little speculative. At breakfast and lunch I always take the same amount of carbohydrates, but in between my physical activities vary. These differences in activity apparently cause an additional spread of 0.10, which, quadratic added to 0.25, yields the value of 0.27 found twice. My somewhat sloppy handling of carbohydrate counting at dinner provides an additional spread of 0.15, which, again quadratic added to 0.27, yields the value of 0.31. This analysis can also be done on even longer series of blood sugar readings. Unfortunately, differences between blood glucose meters might then disturb the result. However, when I apply the same analysis on all 18000 + blood sugar readings taken since I started my 4 times daily insulin regimen, I still find a similar lognormal distribution with a similar R-squared value .
If you keep adjusting your insulin dose for best results, afterwards it is equally likely that you have taken half a unit to little, as that you have taken half a unit to much. It is to assume that your injected insulin dose will follow a normal distribution around the value that would have provided you your target blood sugar. Especially, if your insulin is administered to complement an own fluctuating insulin production. On the other hand, if your blood sugar values spread log normally around your target, a blood glucose value that is half of your target is equally likely to occur as a blood glucose level that is twice your target value.
It is strange that this logarithmic relationship between insulin and blood sugar variations is not recognized in the diabetes treatment, and that patients are taught to use a correction dose, which is directly proportional to the measured blood sugar disorder. Although such a correction dose is easily calculated, it would be much better to base this correction dose on the ratio between the measured and the target blood glucose. As a result a blood glucose value at half of the target value will be corrected with the same insulin dose reduction as the insulin dose increase which is used for a blood glucose value that is twice the target value. This is the method that is used in SugarPal. I am convinced this is better than the traditional approach.
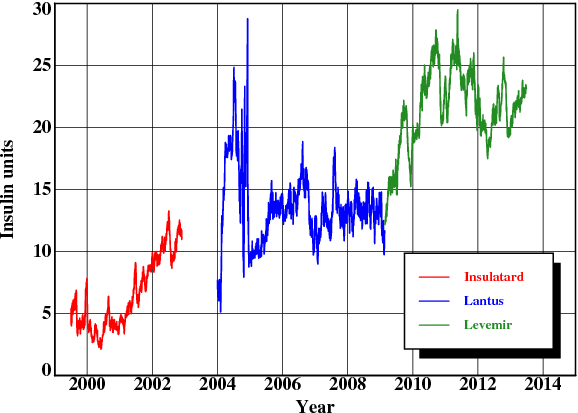
Overview of my need for long-acting basal insulin over the past 14 years.
Above you will find on overview of my need for long-acting basal insulin over the past 14 years. 12 years ago, 2 units were enough to supplement my own insulin production and maintain a proper blood sugar value over the night. Today, more than 20 units are required for this. An increase of about 1.5 units per year. The type of insulin does not even have that much impact. What is striking, is that there were quite some variations in my insulin requirements. Over a period of months, it could easily go up or down with a few units. If I would not have regularly adjusted my long-acting insulin dose myself, but would have waited for my semi-annual check-up to discuss this with my doctor first, I would have had a lot of bad blood sugar levels and probably eventually might have become quite sick. I can imagine that also for my doctor it would have been rather difficult to figure out what I should do about it in the short time available for an average control consultation. This basal insulin readjustment is often a matter of trail and error. And while daily consultations could be helpful, it is not realistic to expect that these are always feasible. The only way to really solve this, is to take controls in your own hands and make the necessary insulin dose adjustments yourself. SugarPal has been designed to make this really easy.
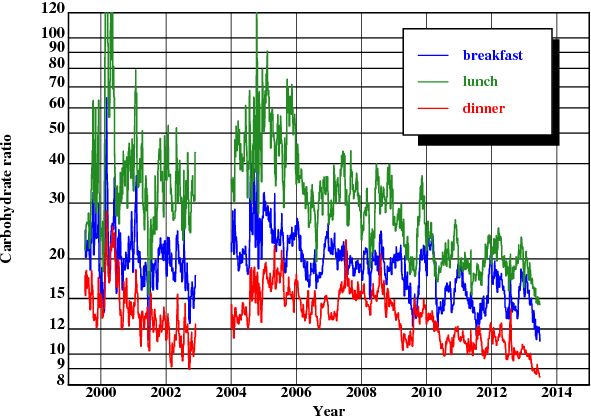
Overview of my carbohydrate ratios over the past 14 years.
Above you will find my carbohydrate ratios over the past 14 years. The carbohydrate ratio is the number by which you have to divide the number of carbohydrates in your meal to determine the bolus insulin dose. If you still have a remnant own insulin production, this number may be very large, because in fact little additional insulin is needed. The three carbohydrate ratios are quite different and fluctuate constantly, as can be seen from the table below. It is evident that during the day my own insulin production is stronger as in the evening. Here too, carbohydrate ratios determined at a certain moment in time, have a limited validity. If there is a variable own insulin production, one can really only expect that the incremental carbohydrate ratios, ie the extra carbohydrates that can be eaten after each additional unit of injected insulin, will remain approximately equal over a longer period of time. Because then the own insulin production plays no role anymore, there is also little reason to believe that this incremental ratio carbohydrate should be taken different for each meal. Especially when the number of carbohydrates taken during meals is not varied that much, it does not seem worthwhile to define separate incremental carbohydrate ratios for every meal.
| carbohydrate ratio | lowest | average | highest |
|---|---|---|---|
| breakfast | 11 | 18 | 64 |
| lunch | 14 | 27 | 100+ |
| dinner | 8 | 13 | 28 |
About SugarPal
If you've read through the above description of the course of my diabetes, you will understand why the approach taken in SugarPal is different from what you might have encountered elsewhere or perhaps have learned from your diabetes treatment team. SugarPal is more than an electronic diabetes diary because it will also calculate the insulin units for you. SugarPal is more accurate in daily use than the bolus wizards that you might find in similar app's or modern insulin pumps, because SugarPal will always take your remaining insulin production into account as well as possible in its dose calculations. Basically, SugarPal uses every blood sugar measurement that you do to determine if your own insulin production remained on the same level, and whether the additional insulin dose needs a readjustment. To this end, SugarPal uses a unique correction algorithm which better reflects the lognormal distribution of blood sugar fluctuations observed in practice.
Sugarpal is the fifth version of a method that I have developed over the past years to better regulate my diabetes. If you have just started with a four times daily insulin regimen, or, like me, already are quite experienced with such a regime, and you are not yet ready for an insulin pump, it may be worthwhile to try SugarPal for some time. I hope it will then be as useful for you as it has been for me over the last 2 years.